Model
Introduction
Graphs are a rich structured data model exploitable to encode information from many different domains, which range from bioinformatics [BNO04] to neuroscience [Spo03], and social networks [New10]. Graphs allow the possibility to encode complex data as a set of parts, i.e. the graph nodes, and a set of relationships between these parts, i.e. the graph edges. Indeed, nodes represent the basic entities that compose the atomic parts of the information, whereas an edge encodes a relationship that links a pair of entities. This model is quite natural in many applications and the encoding is often straightforward, keeping most of the original information in a compact data representation. As an example, the Web can be naturally seen and represented as a graph, with nodes corresponding to web pages (and storing their content), and edges standing for the hyper-links between them [BBS15].
Many classical machine learning approaches assume to deal with flat data, encoded as real valued vectors. Even if it is possible to obtain simpler representations from complex data structures, such as graphs, this process — typically with some sort of graph traversal — always implies a loss of information, an inaccurate modeling of the problem at hand or a higher complexity in the input data distribution.
The GNN model
Graph Neural Networks (GNNs) [Scarselli2009TheGN] are able to process input data encoded as general undirected/directed labeled graphs. GNNs are provided with a supervised learning algorithm that, beside the classical input-output data fitting measure, incorporates a criterion aimed at the development of a contractive dynamics, in order to properly process the cycles in the input graph.
A GNN processes a graph in input and it can be naturally employed to compute an output for each node in the graph (node–focused computation). The training examples are provided as graphs for which supervisions are given as output target values for a subset of their nodes. This processing scheme can be adapted to perform a graph–based computation in which only one output is computed for the whole graph.
A graph \(G\) is defined as a pair \(G=(V,E)\), where \(V\) represents the finite set of nodes and \(E \subseteq V \times V\) denotes the set of edges. An edge is identified by the unordered pair of nodes it connects, i.e. \(e = (a,b)\), \(e \in E\) and \(a,b \in V\). In the case in which an asymmetric relationship must be encoded, the pair of nodes that defines an edge must be considered as ordered, so as \((a,b)\) and \((b,a)\) represent different connections. In this case, it is preferable to use the term arc, while the corresponding graph will be referred as directed.
The GNN model has been devised to deal with either directed or undirected graphs. Both edges and nodes can be enriched by attributes that are collected into a label. In the following we will assume that labels are vectors of predefined dimensionality (eventually different for nodes and edges) that encode features describing each individual node (f.i. average color, area, shape factors for nodes representing homogeneous regions in an image) and each edge (f.i. the distance between the barycenters of two adjacent regions and the length of the common boundary), respectively.
The computation is driven by the input graph topology, which guides the network unfolding.
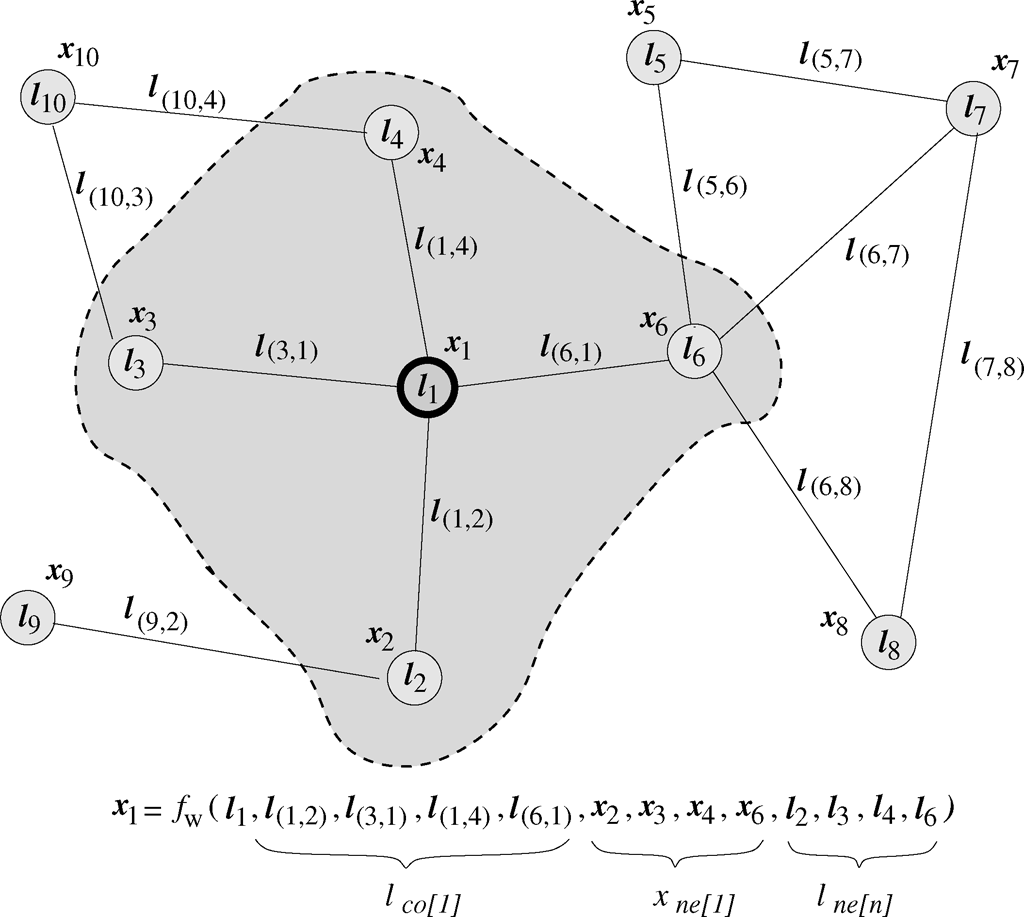
We can attach a state \(x_n \in \mathbf{R} ^s \) to each node \(n\), based on the information contained in the neighborhood of the node. Moreover, each node and arch can be characterized by a label, respectively \(l_n \in \mathbf{R} ^q \) and \(l_{(n,v)} \in \mathbf{R}^p \) are the labels attached to the node \(n\) and the arc connecting \((n,v)\). The computational scheme is based on a diffusion mechanism, by which the GNN updates the state vector at each node as a function of the node label, and of the informative contribution of its neighborhood (edge labels and states of the neighboring nodes), as defined by the input graph topology. The state is supposed to summarize the information relevant to the task to be learnt for each node and, given the diffusion process, it will finally take into account the whole information encoded in the input graph. Afterwards, the state is used to compute the node output.
Let \(f_w\) be a parametric function, called local transition function, that drives the diffusion process and models the dependence of \(x_n\) with respect to the context of node \(n\). Let \(g_w\) be the local output function, which describes how the output for each node is produced.
Hence, the state and output computation are defined as:
where \(l_n,l_{co[n]},x_{ne[n]},l_{ne[n]}\) are respectively the label of \(n\), the labels of the connected edges, the states and the labels of the nodes in the neighborhood of \(n\).
A drawback of this formulation is that the transition function has a variable number of arguments depending on the neighborhood size. Moreover, when the set of neighbors is not ordered, the function \(f_w\) should be invariant with respect to a permutation of the nodes in the neighborhood.
A simple solution is to reformulate the state evaluation function as
given the label of the arc between the nodes \(n\) and \(u\), i.e. \(l_{(n,u)}\), and the label of the current node \(l_n\).
The summation in the reformulated equation (1) allows us to deal with any number of neighbors without the need of specifying a particular order for the set of the neighbors.
The application of equation (1) for all the nodes in the graph defines a system of non–linear equations in the unknowns \(x_n, n \in V\). The solution can be computed by the Jacobi iterative procedure as
that implements the diffusion process for the state computation. If the state transition function \(f_w\) is a contraction mapping, the Banach Theorem guarantees that the iterative procedure converges to a unique solution [Scarselli2009TheGN], that is the fixed point of equation (2). In practice, the required iterations can be limited to a maximum number.
Both \(f_w\) and \(g_w\) can be implemented by simple multilayer perceptrons (MLPs), with a unique hidden layer. The computation of Eq. (2), represents the unfolding of the so called encoding network, where \(f_w\) and \(g_w\) are computed for each node.
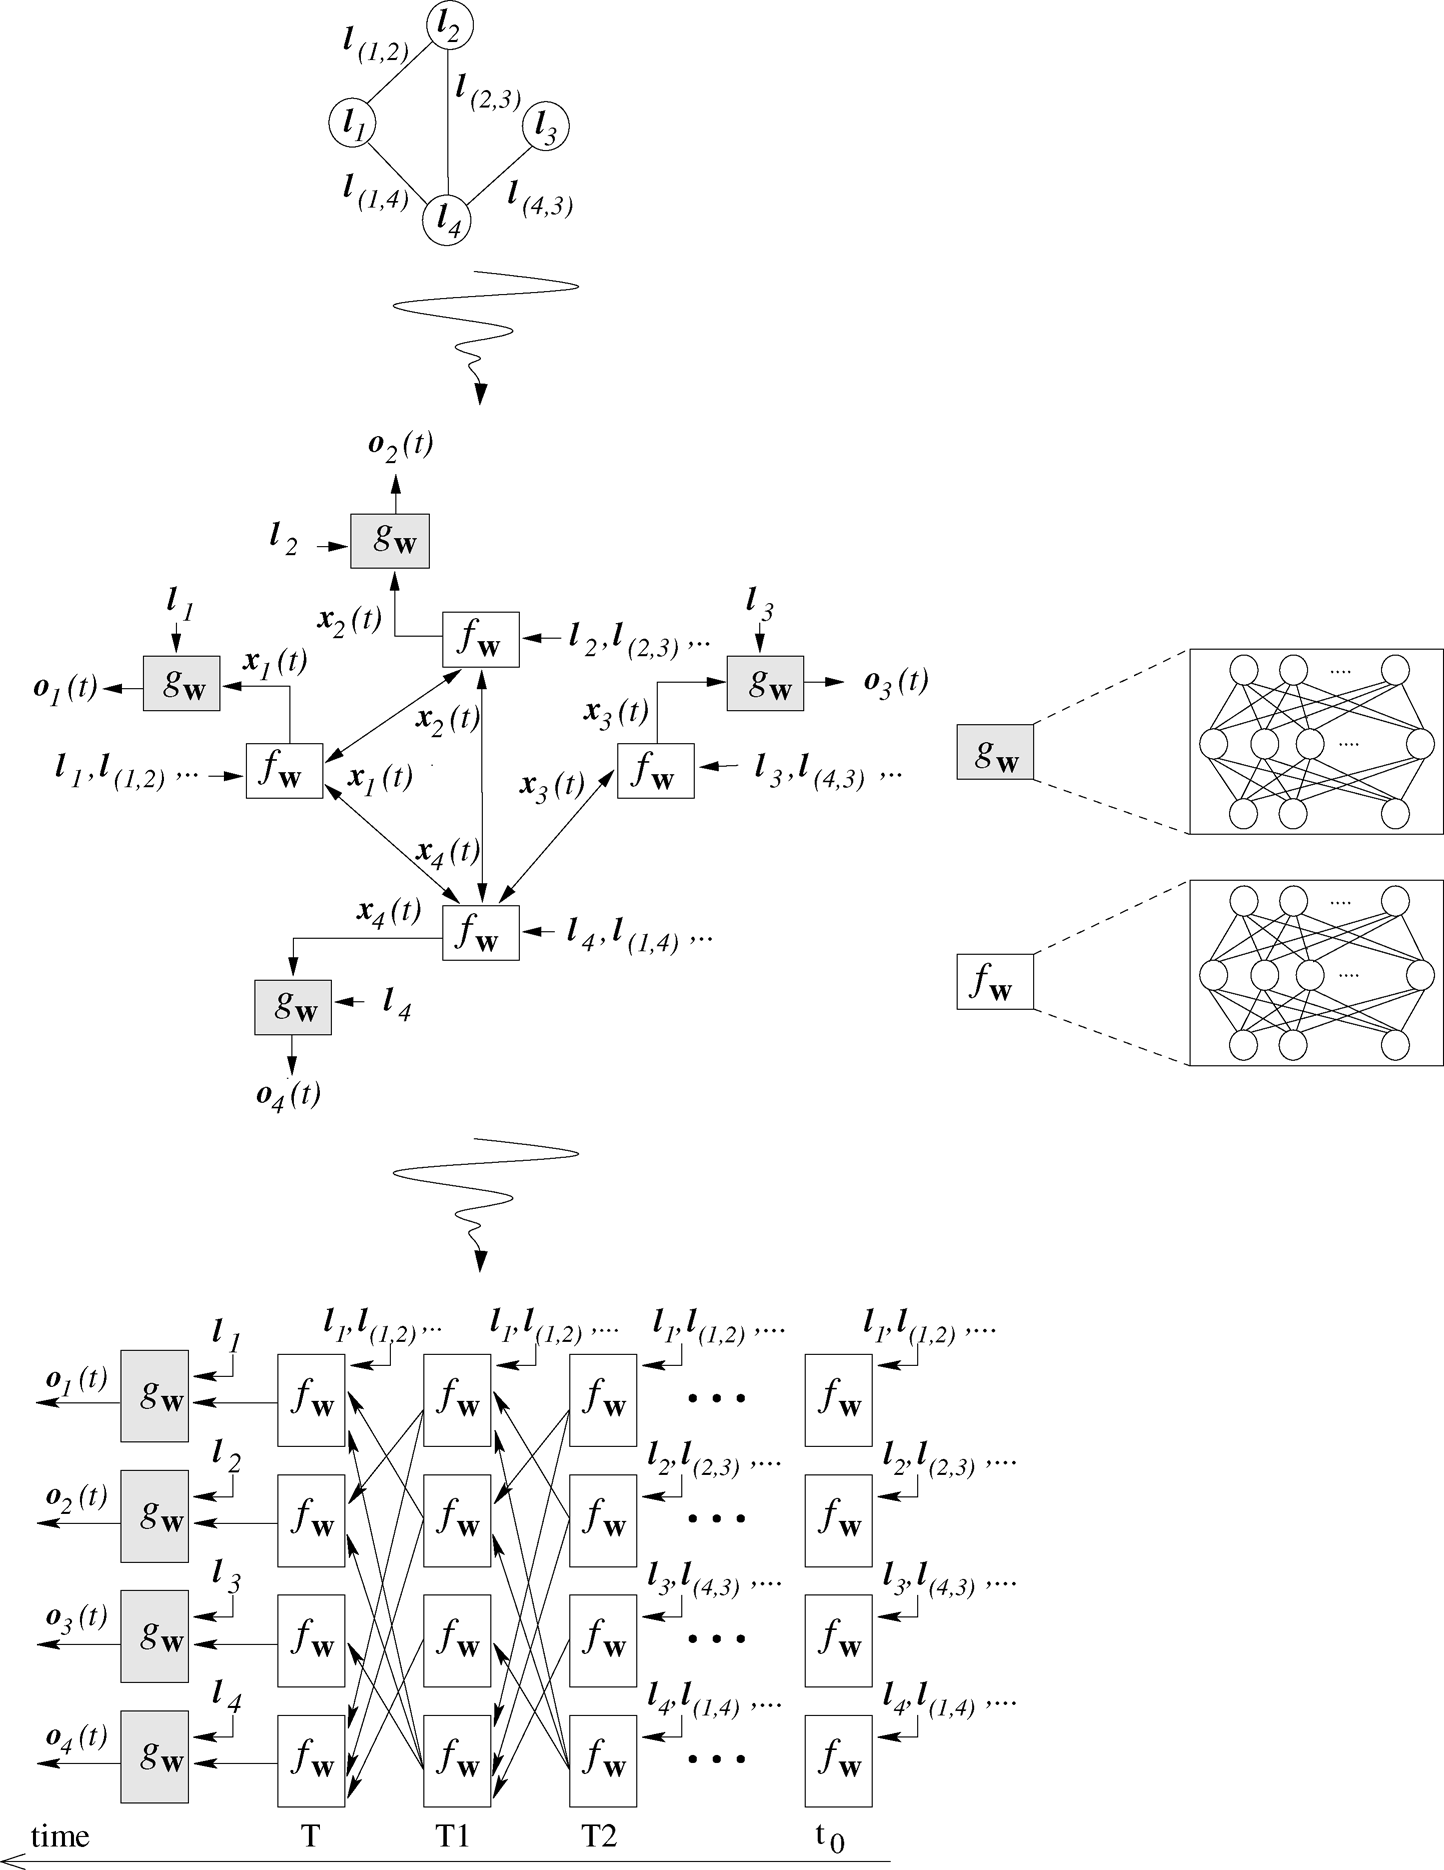
Basically, at each node in the graph, there is a replica of the MLP realizing \(f_w\). Each unit stores the state at time \(t\), i.e. \(x_n(t)\). The set of states stored in all the nodes at time \(t\) are then used to compute the states at time \(t+1\). The module \(g_w\) is also applied at each node for calculating the output, but only after the state computation has converged.
See [Scarselli2009TheGN] and [BM13] for additional details.